Decoding Foot Traffic Data to Reveal Optimal Timing for Table Game Participation at Integrated Resorts

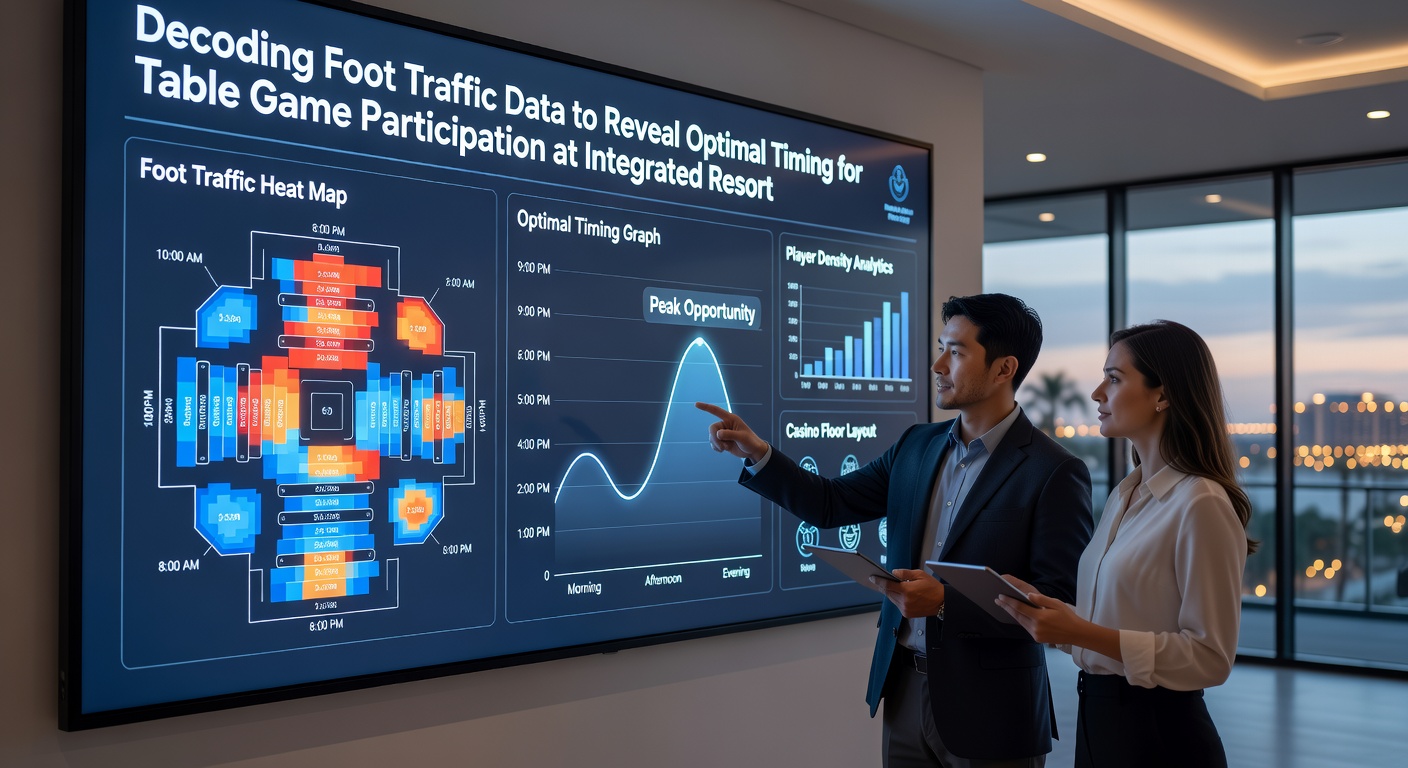
Integrated resorts collect foot traffic data through a combination of Wi-Fi tracking systems, camera analytics, and mobile device sensors that monitor movement patterns across gaming floors, and this information helps operators identify periods when table games experience higher or lower participation rates. Analysts process the resulting datasets to determine how visitor density correlates with game availability, dealer staffing levels, and player wait times at blackjack, roulette, and poker tables. Research from institutions such as the University of Nevada's International Gaming Institute shows that these metrics often reveal recurring daily and weekly cycles that influence when enthusiasts choose to join table games rather than electronic alternatives.
Collection Methods Behind Foot Traffic Insights
Operators install overhead cameras equipped with computer vision software that counts individuals entering specific zones while maintaining privacy standards set by regulatory bodies, and they supplement this with anonymized smartphone signals captured through in-house networks. Data aggregation platforms then merge these inputs with point-of-sale records from table game pits to build comprehensive models of crowd behavior throughout operating hours. Observers note that such systems operate continuously, generating time-stamped logs that allow comparison across seasons, holidays, and special events without requiring manual observation by staff.
Patterns Linking Density to Table Game Participation
Foot traffic volumes typically rise during evening hours and on weekends, yet participation at table games does not always follow the same curve because some visitors prefer quieter periods when dealers can provide more personalized attention. Studies have documented lower table occupancy during mid-afternoon slots even when overall resort attendance remains moderate, suggesting that certain demographic groups schedule their play around meal times or entertainment schedules. Those who examine longitudinal records find that integrated resorts in urban centers often see secondary peaks just after convention sessions conclude, creating brief windows when new arrivals seek table games before the main evening rush begins.
Analysts cross-reference these observations with historical performance metrics to isolate variables such as table minimums, promotional offers, and nearby attraction schedules that shift player preferences. The resulting correlations help explain why certain mid-week mornings attract steady streams of locals who favor lower-stakes tables while tourist-driven evenings favor higher-limit games with larger crowds.
Applying Data to Determine Participation Windows
Resort management teams use predictive algorithms trained on past foot traffic records to forecast table occupancy rates up to several days ahead, allowing adjustments in dealer schedules and table openings that align supply with expected demand. When models indicate lighter foot traffic in table areas, operators sometimes reduce minimum bets to encourage earlier participation or extend hours for specific game types that historically draw consistent players during those windows. Figures released by the Nevada Gaming Control Board illustrate how such timing adjustments have coincided with measurable changes in table game revenue distribution across different daily segments.
Players who review publicly shared resort activity summaries or third-party analytics services can identify similar patterns, though access to granular internal data remains limited to authorized personnel. What's interesting is how external factors like nearby sporting events or transportation delays appear in the datasets as temporary dips or surges that deviate from baseline rhythms yet still follow broader seasonal trends.
Regional Variations and Emerging Trends Through 2026
Integrated resorts in Asia-Pacific markets often display distinct morning peaks driven by tour group arrivals, whereas North American properties more commonly show pronounced evening concentrations tied to dining and show schedules. Reports compiled by the Asia Pacific Gaming Council highlight how climate-controlled environments and integrated hotel occupancy rates further modulate these flows, creating opportunities for operators to fine-tune table game availability in response to real-time sensor feedback. Projections for May 2026 suggest continued refinement of these systems as resorts incorporate newer sensor technologies capable of distinguishing between transient foot traffic adn sustained table game engagement.
Collaboration between data scientists and gaming operations staff continues to evolve, with machine learning models now incorporating weather forecasts, flight arrival statistics, and local event calendars to improve timing predictions. Observers note that these advances allow resorts to maintain balanced table game utilization even during shoulder periods when overall visitor numbers fluctuate.
Practical Outcomes for Resorts and Participants
Resorts that implement foot traffic informed scheduling report smoother dealer rotations and reduced player wait times at popular tables, which in turn supports higher satisfaction scores tracked through post-visit surveys. Participants who align their visits with data-derived quieter intervals often encounter shorter lines for seat assignments and more consistent game pace, although outcomes depend on individual preferences for atmosphere versus efficiency. Industry analyses from the Canadian Gaming Association indicate that transparent communication of peak and off-peak periods through mobile apps helps distribute arrivals more evenly across available hours.
Security and compliance teams also benefit from these datasets because unusual traffic deviations can signal operational issues or require additional monitoring without disrupting normal table game flow. Continued investment in sensor networks and analytics platforms positions integrated resorts to respond dynamically as visitor behaviors shift in response to broader economic or travel trends.
Conclusion
Foot traffic data provides integrated resorts with measurable indicators that guide decisions about when table games receive optimal staffing and promotional support, and the same information offers participants clearer visibility into periods that match their preferred pace and crowd levels. Ongoing advancements in collection methods and predictive modeling ensure that these insights remain current as new resorts open and existing properties expand their offerings. By 2026, further integration of multi-source datasets promises even more precise alignment between visitor movement patterns and table game availability across global markets.