Charting Seasonal Traffic Shifts to Refine Game Selection Sequences at Multi-Format Resorts
Alex Neumann · Jun 23, 2026

Charting Seasonal Traffic Shifts to Refine Game Selection Sequences at Multi-Format Resorts
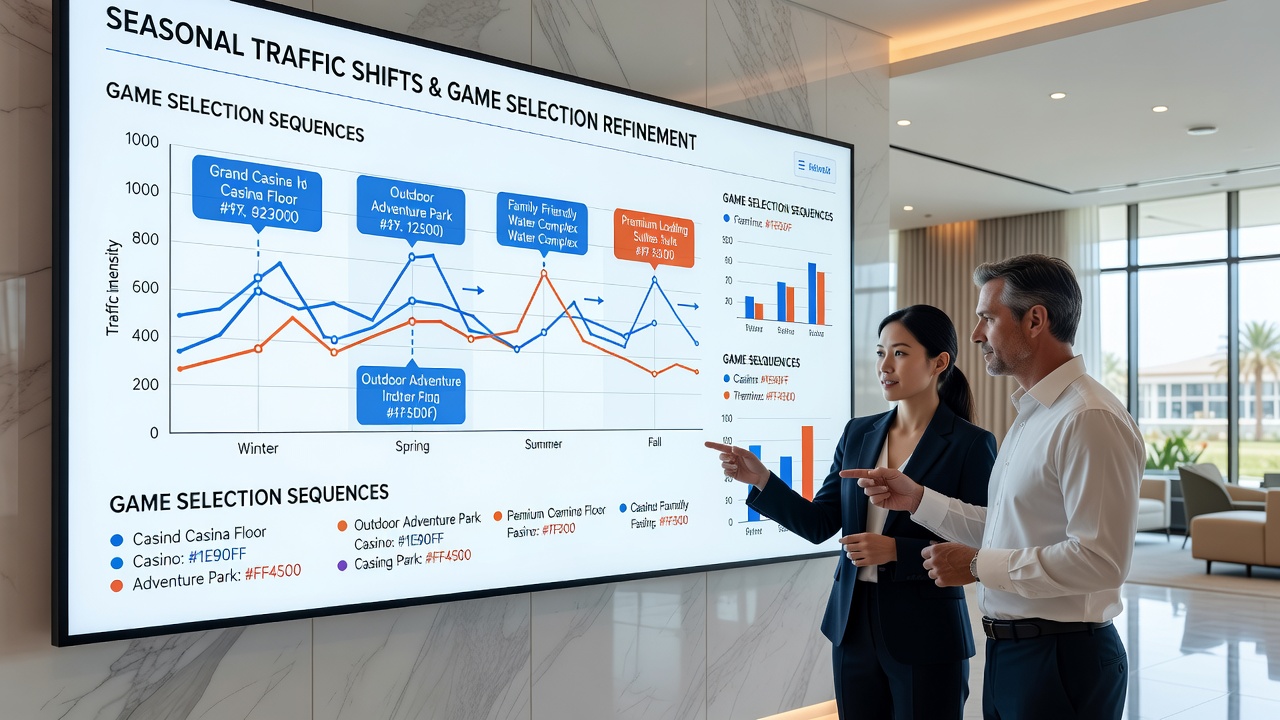
Multi-format resorts track visitor movements across slots, table games, and live dealer areas to adjust game availability based on predictable seasonal patterns, and data from property management systems reveals clear cycles tied to holidays, weather, and regional events. Operators collect foot traffic metrics through loyalty card scanners and camera analytics, then map these against revenue reports to determine when certain formats gain or lose popularity.
Summer months often see increased slot activity at properties near vacation destinations because families and leisure travelers favor quick-play machines over extended table sessions. In contrast, winter periods draw more consistent table game participation from local regulars who prefer structured games during shorter daylight hours. Resorts in climates with distinct seasons record up to 35 percent swings in daily table utilization between December and July according to aggregated operational records.
Data Collection Methods Across Properties
Properties integrate mobile app check-ins with on-site sensors to build hourly traffic profiles, and these systems flag transitions such as morning rushes toward progressive jackpot banks or evening migrations to poker rooms. Analysts cross-reference this information with weather reports and flight arrival data to forecast demand spikes. One study from the University of Nevada Reno examined three years of records at integrated resorts and identified recurring peaks in roulette participation during spring break weeks when younger demographics arrive in larger groups.
Software platforms allow managers to sequence game floor layouts dynamically, moving high-demand titles into high-traffic zones while reducing minimum bets on slower tables during off-peak windows. This approach relies on historical datasets rather than real-time guesses, and properties that apply these adjustments report steadier daily win percentages across formats.
Regional Patterns and 2026 Observations
June 2026 brought typical early summer surges at North American destinations where school breaks align with favorable travel conditions, resulting in elevated slot floor occupancy from mid-morning through late evening. Canadian properties near border crossings noted parallel increases in table game sessions as international visitors extended stays, while Australian resorts experienced comparable shifts during their winter tourism influx. These patterns repeat annually yet vary in intensity based on economic indicators such as fuel prices and currency exchange rates.
Resorts compile these seasonal datasets into sequence models that recommend specific game rotations weeks ahead, allowing procurement teams to schedule maintenance or new installations during anticipated lulls. For instance, video poker banks receive priority placement near entrances during fall shoulder seasons when business travelers favor short sessions between meetings.
Implementation of Sequence Adjustments
Once traffic charts highlight consistent movements, floor teams test revised sequences on limited sections before full rollout. A trial at one Midwest property shifted electronic table games closer to the main entrance during spring conventions and recorded measurable uptake in participation rates without displacing core slot revenue. Such experiments rely on control groups and A/B testing protocols to isolate the impact of layout changes from external variables.
Integrated loyalty programs further refine these sequences by segmenting player preferences according to visit timing. Data shows that reward tier members who arrive mid-week in off-season months gravitate toward table games offering higher limits, while weekend leisure crowds cluster around themed slot banks. Managers use these insights to allocate dealer shifts and machine denominations accordingly.
Integration with Broader Operational Planning
Traffic charting connects directly to marketing calendars because promotions timed with known seasonal surges amplify engagement across targeted formats. Resorts coordinate direct mail campaigns and app notifications to steer players toward underutilized sections during predicted dips, maintaining balanced floor activity. Reports from the Nevada Gaming Control Board document how properties that align marketing with traffic data maintain more consistent monthly handle across slots and tables compared with those using static schedules.
Long-term planning incorporates climate and event forecasting models to anticipate disruptions such as major sporting events or regional festivals that temporarily alter visitor demographics. These models draw from multiple years of anonymized transaction logs to project format preferences under varying conditions.
Conclusion
Seasonal traffic analysis provides multi-format resorts with measurable frameworks for sequencing game availability throughout the year, and continued refinement of collection methods supports more precise adjustments as datasets grow. Properties that maintain consistent tracking across formats position themselves to respond to recurring cycles while accommodating shifts driven by external factors.